Flock drone dashboards are transparent — about what?
They’re full of numbers, but offer few answers to community questions.
By Jennifer Tu
Police agencies across California are flying drones over our neighborhoods at alarmingly increased rates. The agencies using Flock's drone program often share a public dashboard, presented as transparency.
But transparency depends on who gets to ask the questions, and the dashboard answers its own questions: how many calls drones responded to, how quickly they arrived, the number of subjects located, and many more. The public didn't choose these questions. The answers fill the page with large numbers and colorful charts. It looks official and complete, which can make asking any additional questions seem unreasonable. That leaves community questions unanswered: how agencies decide when to fly, who is affected, who data is shared with, what safeguards exist, and what it all costs.
It's a familiar move from press conferences, where a true, confident answer can still be an answer to a question the speaker picked.
"You wanna look smart? Answer their question with your own question, and then answer that question." —Nick Wilde
So which questions do Flock's drone dashboards ask on the public's behalf, and which do they leave out? We looked at the Alameda County Sheriff's Office Flock drone dashboard to find out.
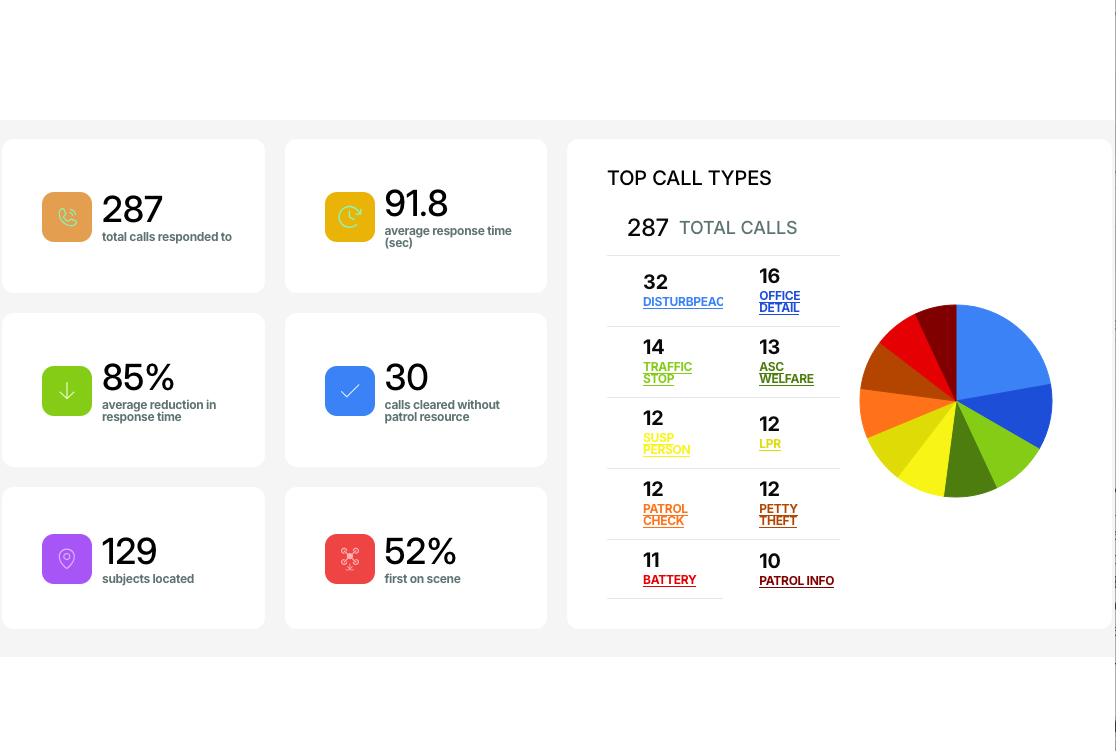
The Alameda County Sheriff's Office Flock drone dashboard for July 1, 2025 – June 30, 2026, as captured on October 7, 2026. The "Top call types" chart lists ten call types, covering 144 of the 287 calls.
What Flock's drone dashboards count...
- Average drone response time
- Shows how fast the drone arrived, not what it did there.
- Reduction in response time
- But compared to what?
- How often the drone was first on scene
- Arriving first gives officers early information. Whether that changed the outcome isn't shown.
- Subjects located
- Counts people located, not their race or why they were suspected.
...and what they don't
- Cost per drone flight, including staff time
- Drones are pitched as cheaper than sending a patrol officer. But the same money could fill potholes or keep libraries open longer.
- Flights where an officer was also sent
- Shows whether drones replace officers, or add surveillance to the same response.
- Hours of video taken
- One measurement of surveillance quantity
- Times video was shared outside the agency
- A request from another agency, federal or local, can put local footage to uses residents never agreed to.
- Mistakes and complaints
- No metric on the dashboard goes up when something goes wrong.
Flock’s dashboard only tracks the benefits of its drones. It doesn’t track what a drone program costs the community, or the harm it can cause.
Cheaper than what? Drone programs are often presented as a cheaper alternative to sending an officer. That comparison assumes the money goes to policing either way. A city could instead start from the result it wants, like fewer collisions, faster help in a crisis, or safer streets at night, and ask what's the most effective way to pay for it. Streetlights, crisis care, and youth programs could all make neighborhoods safer too.
To have that conversation, communities need to know the full cost. In California, state law AB 481 requires law enforcement agencies to report the annual costs of drones and other "military equipment," including acquisition, maintenance, training, and personnel costs. If your local agency's annual use report leaves any of those out, that's a good place to start asking.
Flock's pie chart shows half the picture
The dashboards also include a "TOP CALL TYPES" pie chart that looks complete. But it only shows the ten most common call types. On the Alameda County Sheriff's Office dashboard for July 1, 2025, to June 30, 2026, the ten call types in the chart account for 144 of the 287 calls. The other 143, about half, aren't in the chart at all, so every slice looks about twice as big as it really is.
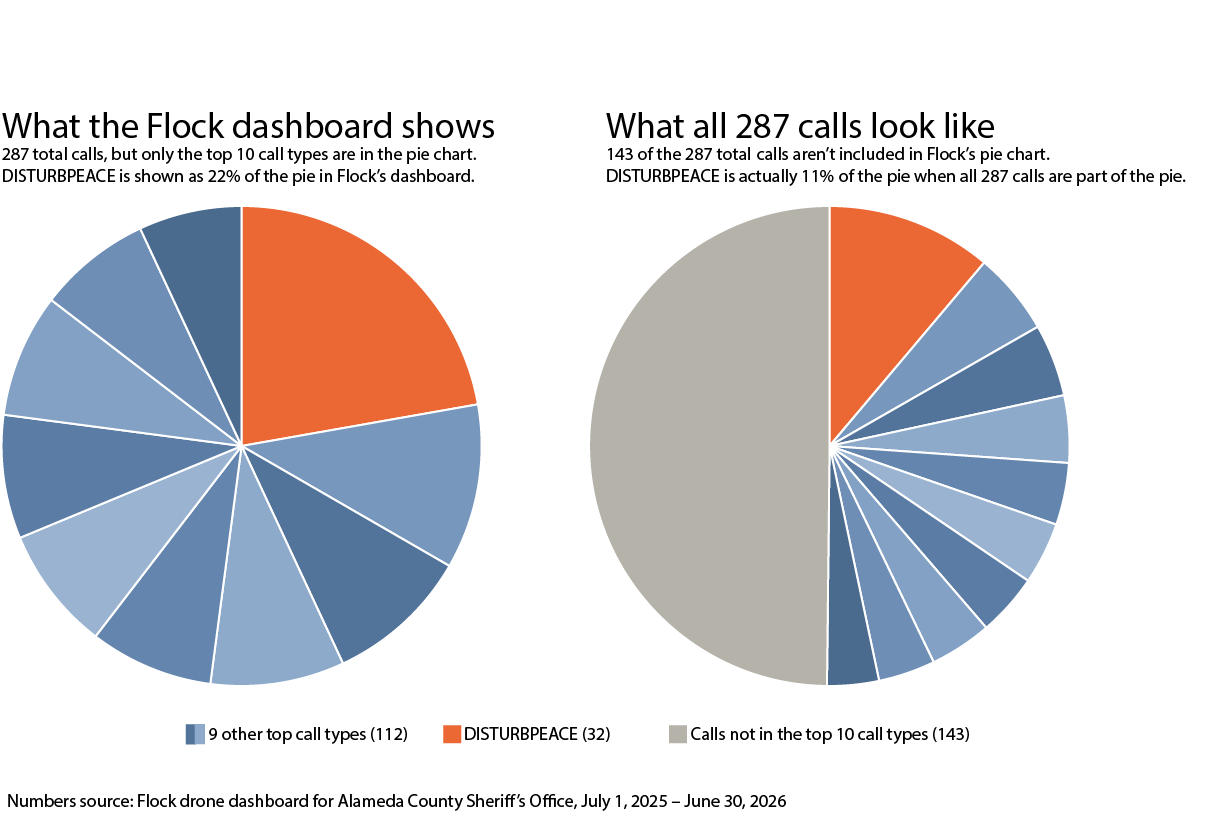
Leaving out half the calls hides the less common reasons drones are sent, which are often the unusual uses residents would most want to see.
The chart's labels are the call types recorded for each flight, and they aren't standardized. Two of the top ten on Alameda County's dashboard for this period, "PATROL CHECK" and "PATROL INFO," look like they could be the same thing, but the dashboard offers no way to tell.
The pie chart also doesn't lead to any details. Alameda County's dashboard chart lists 14 flights with "TRAFFIC STOP" call types, but clicking through gives no dates, locations, or durations. Flight logs are on a separate Flights tab, eight flights per page, with no download option: about 36 pages of clicking to find which flights are associated with the "TRAFFIC STOP" call type.
Communities deserve answers about drone use
Flock has said its dashboard is meant to show how valuable a drone program is, and it does that well. However, showing value isn't the same as answering the community's questions. Communities deserve answers to their own questions, including how much surveillance a police drone program adds to their neighborhoods.
These dashboards could also show what a drone program costs, how much video it records, how often that video is shared, and how many complaints it draws. None of that needs new technology. Some of it, like the full cost of a drone program, is already required by state law in an agency's annual AB 481 report. The rest exists in agency records or Flock's own systems. Asking an agency to publish it is a reasonable request, and agencies that are committed to transparency should be willing to publish them.
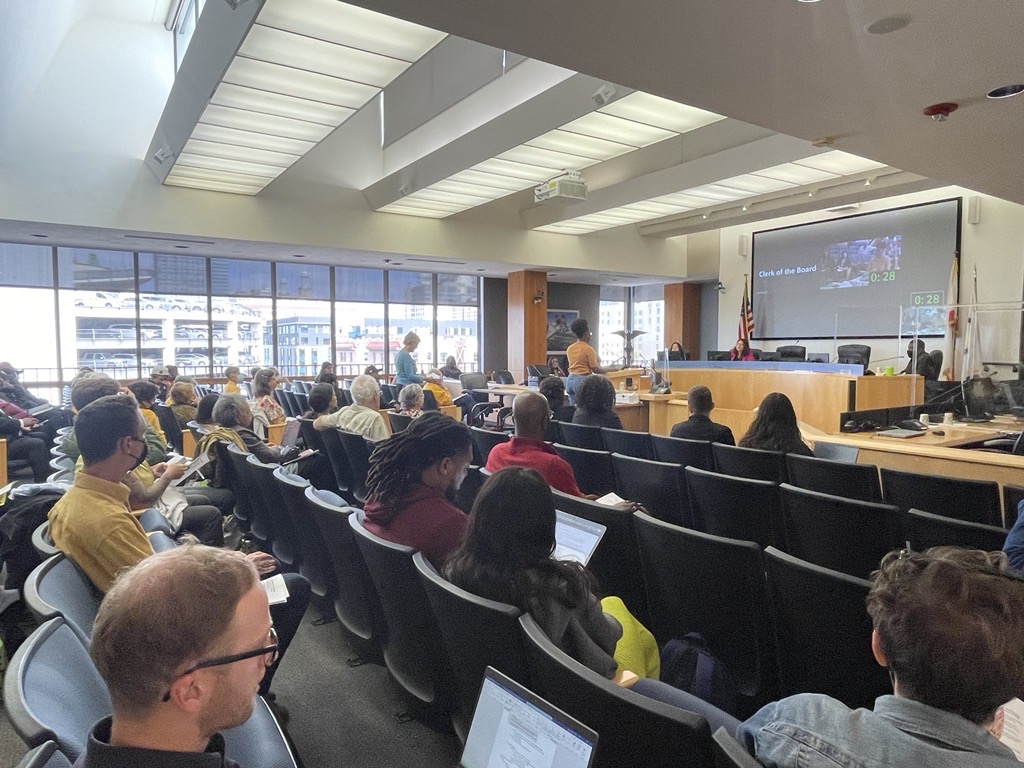
If your city or county flies drones, check whether it publishes a drone dashboard, and compare it with the questions on this page. In California, law enforcement agencies must also hold a public meeting where anyone can ask about their "military equipment," including drones, within 30 days of publishing their annual report. That's a good place to bring these questions.
Ask what the dashboard doesn't show.